GlitchTip 1.3: Breadcrumbs, better tags, and some work on performance monitoring
Our latest release focuses on major backend improvements including initial support for performance tracking, SDK breadcrumbs, and an entirely redone event tag system. This post will be more technical as this work will enable future features.
We also fixed a number of bugs and added polish based on a recent user study.
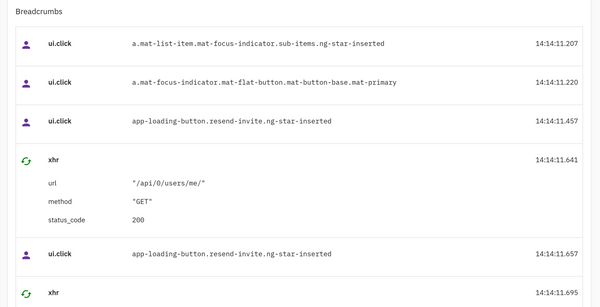
Breadcrumbs

The open source Sentry SDK supports adding more information to errors via breadcrumbs. Breadcrumbs are now supported in GlitchTip.
Performance Tracking
The open source Sentry SDK supports performance monitoring via tracing. GlitchTip will now accept these "transaction" events. Supporting transaction events helps us properly model GlitchTip's event data schema.
The feature is unfinished, though, so it is inaccessible unless you know the URL: /organizations/<org-slug>/performance. Enable tracing in the SDK you installed in your project to view transactions and their timings.
Note that transaction events take a considerable amount of disk space. Be aware of this before enabling tracing.
This work will allow us to use events for other features such as uptime monitoring in the future.
Tags
Tags are now powered by PostgreSQL hstore key-value pairs. This improves GlitchTip's ability to filter by tag. The backend supports querying most common tag values allowing for reports such as the breakdown of browsers associated with an issue. This paves the way for future reporting views. Previously tags were stored in tables instead. When updating to GlitchTip 1.3, existing tags will be deleted.
Support GlitchTip
Help make open source development sustainable:
- Sign up for a paid, hosted GlitchTip plan
- Donate via Liberapay
- DigitalOcean referral link
- Spread the word on sites like AlternativeTo
- Follow us on Gitlab and Mastodon