GlitchTip 1.11: Uptime enhancements and observability API
Uptime Monitoring Charts
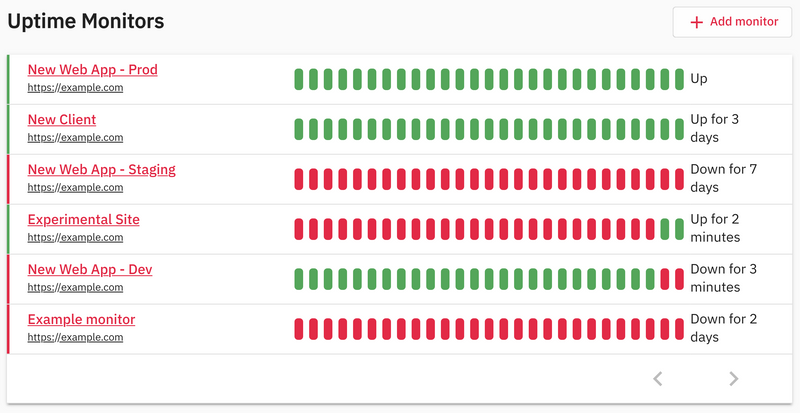
GlitchTip's uptime interface has gotten a makeover with the addition of charts for uptime checks and response times. The uptime list and details pages now include a visual representation of the status of each monitor's last 60 checks. The uptime details page for each monitor also now features a graph of the response times on each of these checks.


Prometheus
Thanks to contributor Jose Gavine Cueto (@pepedocs on GitLab), this release creates a GlitchTip observability API by adding django-prometheus. This API is for monitoring GlitchTip itself using tools like Prometheus.
Coming Soon
Our next focus will be on performance monitoring. This release already expands the performance API and updates the data model for performance events. We plan to add a more robust frontend for this feature to help users see how their apps perform.
Support GlitchTip
Have you starred us on GitLab yet? Starring our project improves its visibility. This helps attract new contributors.